WorldTouch app for iPhone and iPad
Developer: Csaba Boros
First release : 21 Jan 2012
App size: 15.57 Mb
The world at your finger tips: WorldTouch is an interactive data visualization tool. It provides access to the World Bank Open Data Catalog with over thousand global development indicators.
Explore and experience the latest economic, environmental and social data and trends using interactive and intuitive graphical representations.
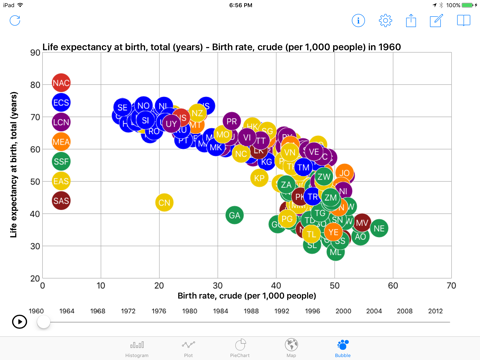
With WorldTouch, you can visualize and compare the time evolution of development indicators, zoom in and out in time to see the appropriate level of details, rank countries with respect to indicators using pie charts and lists, drill down to detailed views, visualize geographical data with maps, explore correlations between indicators and watch how these correlations evolve over time by playing movies of successive snapshots.
If you are a researcher, economist, journalist, student or are simply interested in global economic, environmental, social data, you will find WorldTouch very useful. You can share your data discoveries and explorations by email or social media and use them in your own documents and reports.


